


Everything you need to see your whole portfolio clearly.
One platform, seven ways to stay on top of your money, from the moment you log in to the day a dividend lands.
Start your 14-day free trialNo credit card required.
Jump to
See your whole portfolio the moment you log in
A live dashboard and eight configurable widgets turn scattered numbers into one clear picture.
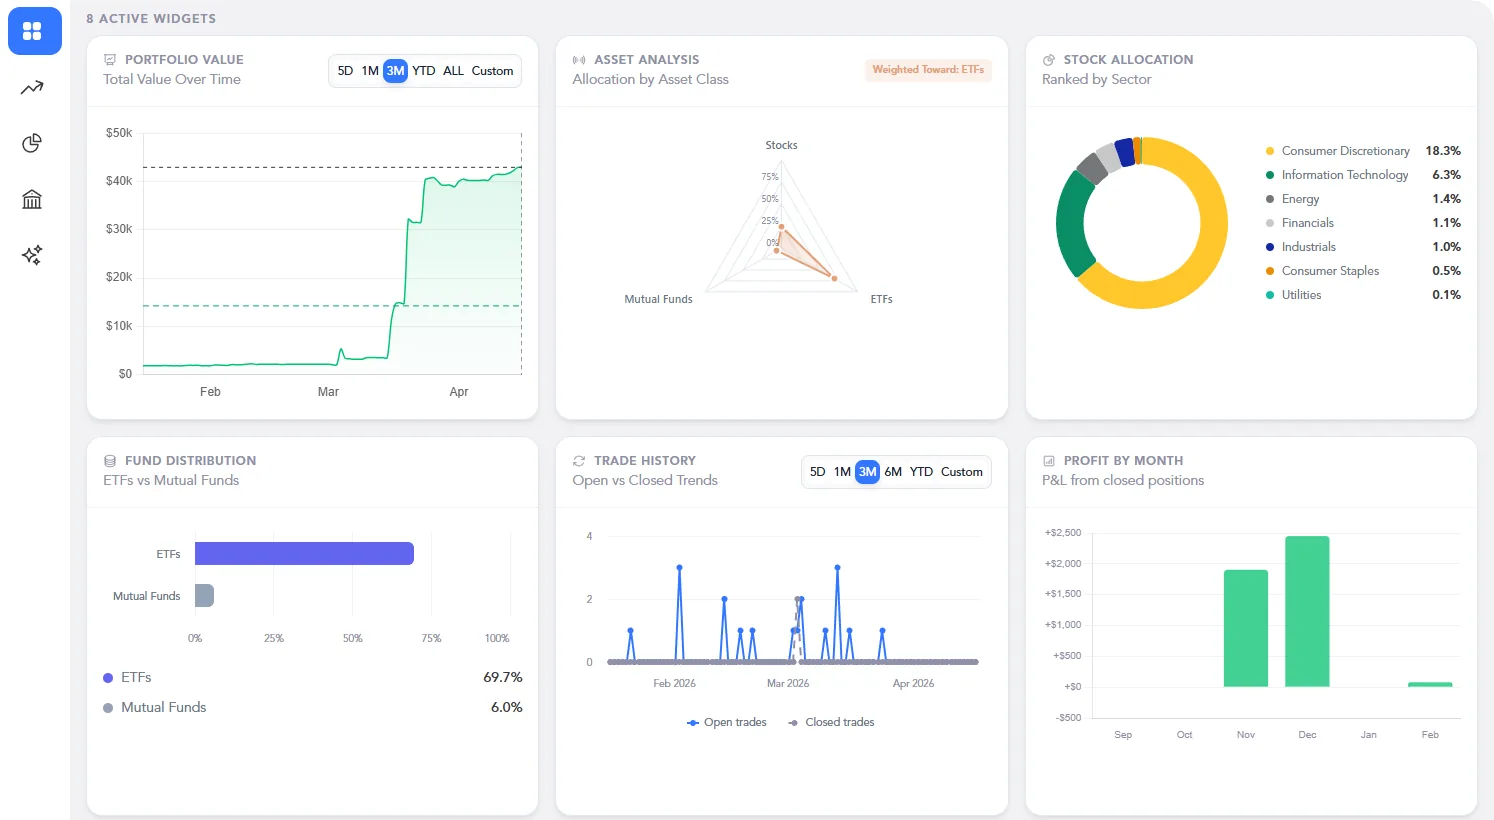
Live performance dashboard
Open to a daily greeting with today's date and your exact dollar and percent change since the prior close, plus a sticky summary bar for total value, unrealized P&L, day change, and connected accounts. Know exactly where you stand, no hunting through menus.
Interactive widgets
Customizable widgets for portfolio value over time, asset allocation, top holdings, sector mix, fund distribution, trade history, and realized and cumulative profit, each with adjustable date ranges. Turn a wall of numbers into a visual story you can actually read.
A complete record of every move you make
Three linked views and automatic reinvestment tracking keep your trade history accurate without the manual cleanup.
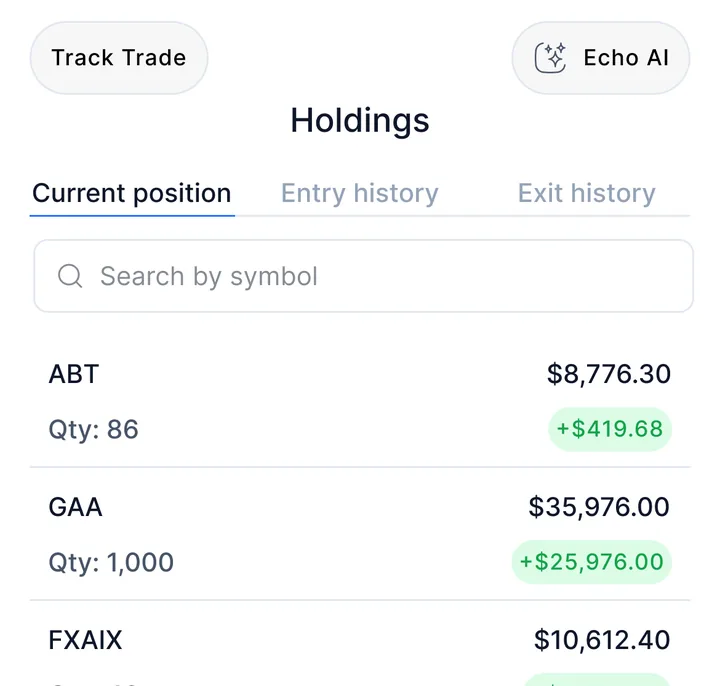
360° position control
Move seamlessly between Current Positions, Open Trades, and Closed Trades (including fractional closures) for a full, cross-account history. Every holding, every exit, accounted for.
Universal 'Track Trade' entry
Log any off-platform or custom asset in seconds with a manual entry button available on every trade view. Nothing falls through the cracks just because it wasn't executed through a connected broker.
Intelligent DRIP tracking
Dividend reinvestments are captured automatically as new entries and rolled into your current positions. Your share counts stay precise without manual reconciliation.
Every account, synced and verified in one place
Dual-engine aggregation and clear connection diagnostics mean your data is always current, and you always know it.
Multi-aggregator sync
Connect through Plaid and SnapTrade to link thousands of brokers and financial service providers. All your accounts, automatically kept up to date.
Universal institution search
Browse featured institutions or search the full global directory to find the specific provider you use. If it's out there, you can likely connect it.
Multi-asset compatibility
Track stocks, ETFs, mutual funds, and crypto side by side on one platform. No more switching between apps to see the full picture.
Deep sync diagnostics
See connection date, aggregator used, last sync time, and status for every linked account at a glance. Trust your numbers because you can verify them.
Understand exactly how your capital is spread
Dedicated breakdown views by asset class, sector, and fund type turn allocation from a guess into a clear picture.
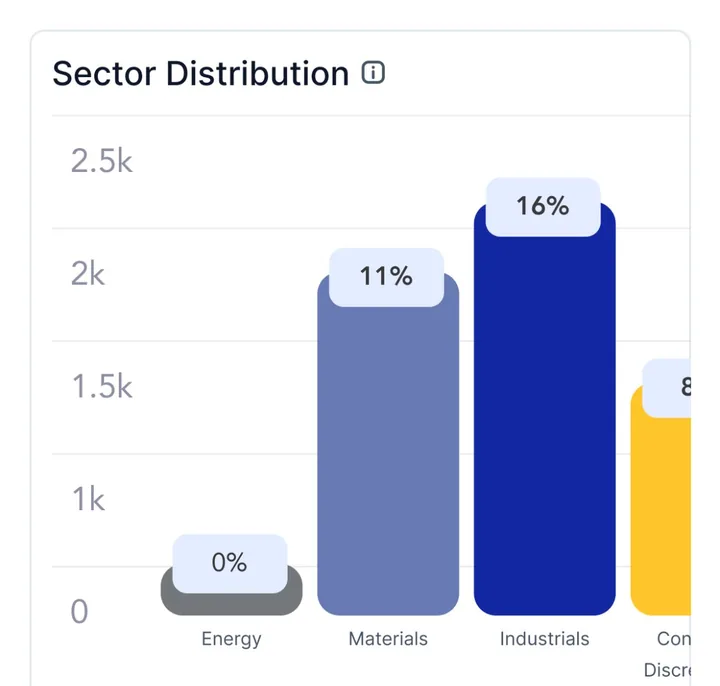
Multi-asset breakdown pages
Dedicated Stocks, Funds, and Crypto tabs each show total value, unique holdings, unrealized gain, and portfolio weight. See the shape of your portfolio, not just the total.
Structural sector analysis
View your equities by sector and industry group to spot concentration at a glance. Clarity on where your exposure actually sits.
Smart fund filtering
Isolate ETFs from mutual funds to see underlying symbols, quantities, and their share of your holdings. Know what you own, not just what it's labeled.
Your full income picture: earned, confirmed, and ahead
Four connected views turn dividend income from a surprise into something you can plan around.
Live dividend growth rate Live
A trailing 12-month Dividend Growth Rate that updates monthly. Track whether your income stream is accelerating, at a glance.
Tri-view income projections
See Total Estimated, Announced, and Forecasted income extending through December of next year. Your income stream, modeled three ways.
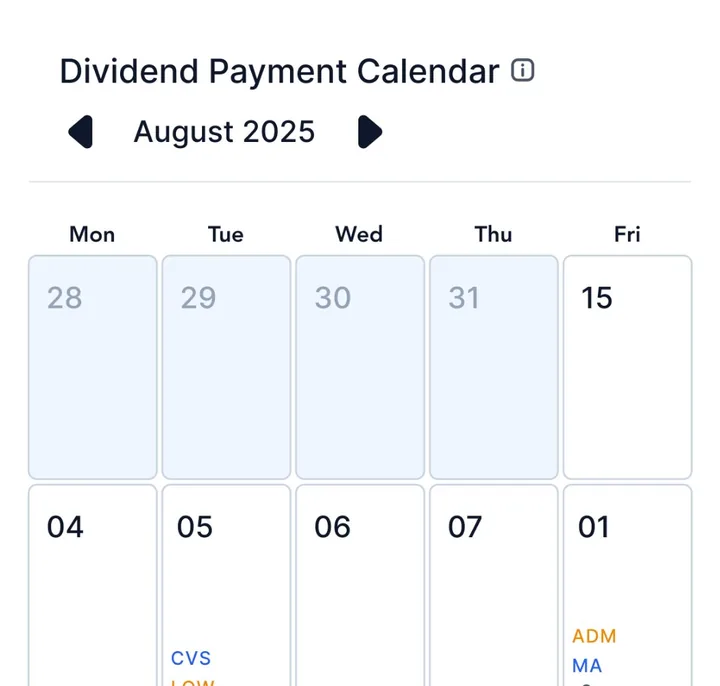
Interactive dividend calendar
A day-specific calendar where clicking any multi-dividend day reveals the total payout and every contributing holding. Know exactly which days your income lands.
Color-coded schedule ledger
A full per-holding table of frequency, next ex-dividend date, payable date, dividend per share, and trailing 12-month yield, color-coded Earned, Announced, or Forecasted. Everything sorted, in one view.
Two ways to see your data: pick what the moment calls for
Echo AI doesn't replace your charts and tables. It sits alongside them, built for the moments when you just need a fast answer.
Charts & tables for deep dives
Your dashboard and widgets give you the full, unfiltered view, built for spotting long-term trends, comparing metrics side by side, and high-precision analysis with the highest level of detail.
Echo AI for rapid insight retrieval
Ask a question in plain language to get a fast summary or pinpoint the exact parameters for a custom report. Echo AI bridges the gap between a complex dataset and a quick answer.
Echo AI is not a financial adviser and uses mathematically modeled, historical, and hypothetical simulations.
Secure by default, simple by design
Bank-grade protections and transparent pricing: no asterisks, no feature gates.

Listed in the Cloud Security Alliance STAR Registry. View listing →

MFA security
Multi-factor authentication is required before any institution search or connection, with tokens you can manage or regenerate anytime. A second layer of verification, always.
Global app settings
Set your preferred timezone and date format once, applied consistently across every table and card. Your data, formatted the way you think about it.
Simple, full-access pricing Free trial
Every plan (Monthly at $9.50/mo, Quarterly, and Yearly) unlocks the complete platform with no feature gating, plus a 14-day free trial that requires no payment information. No paywalls, no upgrade prompts mid-workflow.
Every feature, in one table
What each feature does and why it matters, all in one place.
| Feature | What it does | Why it matters |
|---|---|---|
| Portfolio overview | ||
| Live performance dashboard | Daily greeting with today's date, dollar and percent change, plus a sticky summary bar for value, P&L, day change, and connected accounts. | Know exactly where you stand the moment you log in. |
| Interactive widgets | Configurable widgets for value over time, allocation, top holdings, sector mix, fund distribution, trade history, and profit. | Turn raw numbers into a clear visual story. |
| Trade tracking | ||
| 360° position control | Switch between Current, Open, and Closed trades, including fractional closures. | A complete record of every move you make. |
| Universal Track Trade entry | Manually log any off-platform or custom asset from any trade view. | Nothing falls through the cracks. |
| Intelligent DRIP tracking | Reinvested dividends are captured and rolled into current positions automatically. | Your share counts stay accurate without manual work. |
| Account connections | ||
| Multi-aggregator sync | Connect through Plaid and SnapTrade to thousands of providers. | All your accounts in one place, always current. |
| Universal institution search | Browse featured institutions or search the full directory. | Find the specific provider you use. |
| Multi-asset compatibility | Track stocks, ETFs, mutual funds, and crypto together. | See the full picture in one platform. |
| Deep sync diagnostics | View connection date, aggregator, last sync time, and status. | Trust your numbers because you can verify them. |
| Allocation & holdings | ||
| Multi-asset breakdown pages | Separate Stocks, Funds, and Crypto views with value, holdings, gain, and weight. | Understand exactly how your capital is spread. |
| Structural sector analysis | View equities by sector and industry group. | Spot concentration at a glance. |
| Smart fund filtering | Isolate ETFs from mutual funds. | Know what you actually own. |
| Income & dividends | ||
| Live dividend growth rate | Trailing 12-month DGR, updated monthly. | Track whether your income is accelerating. |
| Tri-view income projections | Total Estimated, Announced, and Forecasted income through next December. | Plan around your income with three lenses. |
| Interactive dividend calendar | Click any day to see the total payout and contributing holdings. | Know exactly when your income lands. |
| Color-coded schedule ledger | Per-holding table of frequency, dates, dividend per share, and yield. | Everything sorted in one view. |
| Echo AI | ||
| Charts & tables | Full, unfiltered view for long-term trends and high-precision analysis. | Best for a detailed, deliberate review. |
| Echo AI insight retrieval | Ask a question in plain language for a fast summary. | Best for a quick answer, fast. |
| Account & subscription | ||
| MFA security | Required before any institution search or connection. | A second layer of verification, always. |
| Global app settings | Set your preferred timezone and date format once. | Your data, formatted the way you think about it. |
| Simple, full-access pricing | Monthly, Quarterly, or Yearly, no feature gating, 14-day free trial. | No paywalls, no upgrade prompts mid-workflow. |
See your whole portfolio clearly.
Every feature on this page, on every plan. Try it all free for 14 days.
Start your 14-day free trialNo credit card required.
Dashboard screens and the Echo AI conversation are illustrative and use mock data. Plaid, SnapTrade and the Cloud Security Alliance are the property of their respective owners and do not sponsor or endorse Orizon. CSA STAR Level One is a self-assessment, not a third-party audit.